Introduction to Descriptive Analysis / Descriptive Statistics
Descriptive Statistics
“Summary measures or summary statistics or descriptive statistics are used to summarize a set of observations, in order to communicate the largest amount of information as simply as possible. Descriptive statistics are the kind of information presented in just a few words to describe the basic features of the data in a study such as the mean and standard deviation (SD).”
Ref: Mishra, P., Pandey, C. M., Singh, U., Gupta, A., Sahu, C., & Keshri, A. (2019). Descriptive statistics and normality tests for statistical data. Annals of cardiac anaesthesia, 22(1), 67.
For continuous variables, descriptive statistics include three main types: (1) measures of central tendency, (2) measures of dispersion, or (3) measures of distribution shape (Bruce, 2018). For categorical variables, frequency analysis is the best way to summarize the data.

A. Frequency Distribution
- Counts / Frequency of respondents for a given response category
- Application: frequency table, bar chart, histogram

B. Measures of central tendency
The most common value (for nominal measures) or the value around which other cases tend to cluster (for quantitative measures) – mean, median, mode

C. Measures of Dispersion
- Measures of how “spread out” the variable is
- A measure of heterogeneity or how different subjects are from the average
- Types
- Range (Difference between highest and lowest scores)
- Variance (square of standard deviation)
- Standard Deviation: an indicator of how “spread out” the numbers are &
- A measure of variation in the sample around the mean
- the most commonly used/reported measure of dispersion
Levels of Statistical Analysis by the number of variables
A. Univariate analyses (one variable)
- Examines one variable at a time.
- Report central tendency (mean, median, mode) & variability (range and standard deviation)
- Examples
- Frequency: Percentage (%)
- Central Tendency: Mean, Median, Mode
- Variability: Standard deviation, range

B. Bivariate analyses (two variables)
- Relationships between two variables
- Describing the sample on key study variables of the model
- Types
- Compare frequency / percentage by groups (Chi-square test)
- (e.g., comparison of the percentage of college grads by nativity)
- Compare means by two groups (T-test)
- (e.g., comparison of the level of depression by gender)
- Compare means by groups (more than 2) (F-test: ANOVA)
- (e.g., comparison of levels of anxiety by race)
- Relationship between 2 variables (r: correlation)
- (e.g., the correlation between discrimination and anxiety)
- Compare frequency / percentage by groups (Chi-square test)


C. Multivariable analyses (multiple variables)
- Describes relationships among multiple variables.
- Report predictors of dependent variables (outcome of interests)
- Example: Multiple regression

Statistical Software

There are many statistical analysis tools, the most popular of which are SPSS, SAS, STATA, and R. Since SPSS uses GUI (i.e., you can simply click the tabs to conduct analysis), it is easier for novices to use than software that requires coding (e.g., STATA, SAS, and R).
However, SPSS subscriptions are costly ($99 per month). Jamovi is a viable alternative as a free GUI-based program.
This YouTube video takes you through the installation of Jamovi and basic descriptive and correlational analysis using Jamovi.

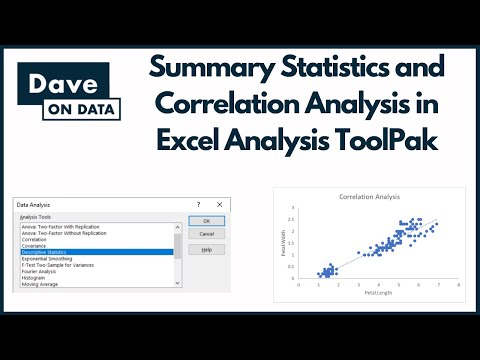
If you think Jamovi is also difficult to learn, you can conduct descriptive analyses using Microsoft Excel and Data Analysis Toolpak.